By Art Minassian | Spectrum Commercial Real Estate | Available Warehouses
If you’re looking for warehouse space in Chatsworth, Canoga Park, Reseda, or Northridge right now, you’re operating in a market that has shifted — and the data confirms it.
As industrial agents working daily across the West San Fernando Valley, we’re seeing what the CoStar numbers back up: vacancy is up, rents are off their peak, and smart buyers and tenants are moving while sellers are still motivated.
Here’s what the market looks like right now, with real numbers.
West SFV Industrial Market: The Q1 2026 Snapshot
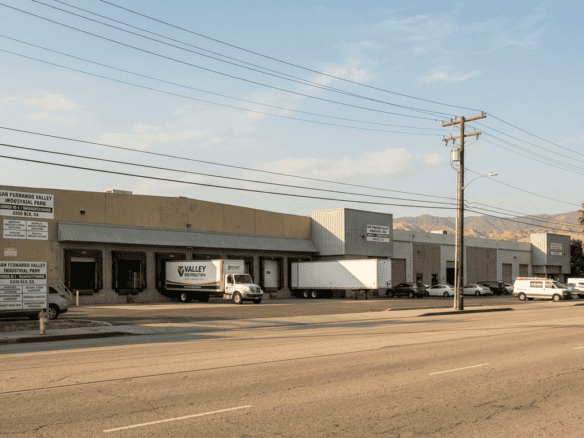
The West San Fernando Valley industrial submarket covers approximately 48.9 million square feet of industrial inventory — the largest submarket in the SFV corridor. That includes logistics and warehouse space, specialized manufacturing, and flex space stretching from the 405 freeway west to Ventura County along the 101.
Key stats as of Q1 2026:
- Vacancy rate: 6.0% — up from under 2% in early 2022
- Market asking rent: $20.51/SF annually — down approximately 3.5% year-over-year
- 12-month net absorption: (477,000) SF — meaning more space is being vacated than leased
- Sales volume 2025: approximately $191.7M across 64 transactions
- Average sale price: $233/SF (well below the $342/SF market pricing peak)
- Average building size sold: 16,408 SF — confirming the owner-user sweet spot
These are not alarming numbers. They are opportunity numbers.
Why Vacancy Is Up — And What It Means for You
The increase from 2% to 6% vacancy didn’t happen overnight, and it isn’t a sign of collapse. It reflects a specific sequence of events:
- Aerospace and high-tech manufacturing firms downsized and shut down operations
- Furniture and home décor companies, hit by slow home sales, vacated large spaces
- Logistics firms that expanded during the pandemic right-sized
- Some occupiers relocated to the Inland Empire for lower costs
The result: more available space than we’ve seen since 2012.
For buyers, this is leverage. Sellers who have held properties for 15+ years still have enormous equity, but the urgency to price aggressively is real. Cap rates have risen to the mid-5% range, creating better entry pricing than anything we’ve seen in a decade.
For tenants, this is concessions. Landlords who were offering nothing two years ago are now discussing 4–5 months of free rent on five-year leases. Effective rents are down as much as 30% from peak depending on building size and location.
The Supply Constraint That Protects Long-Term Value
Here’s what doesn’t change regardless of the cycle: the West SFV cannot build its way out of vacancy.
Over the past decade, 2.0 million SF of industrial inventory has been demolished in this submarket — converted to residential, transit corridors, and office uses. The Warner Center 2035 Specific Plan alone is reshaping the Woodland Hills industrial footprint toward high-density residential.
New construction is effectively zero. The only proposed project in the pipeline is a 58,838 SF building at 21555-21627 Roscoe Blvd, slated to break ground in July 2026.
That means every building vacated today is a building that likely won’t be replaced. Long-term, the supply picture favors owners.
What’s Actually Selling in the West SFV Right Now
The 65 transactions recorded in the submarket over the past 12 months tell a clear story about where the deals are happening:
| Metric | West SFV Market |
| Average sale price | $3.7M |
| Median sale price | $3.25M |
| Average price/SF | $229 |
| Median price/SF | $265 |
| Average building size | 16,408 SF |
| Average year built | 1973 |
| Average vacancy at sale | 3.9% |
The highest-priced recent sale: 20640 Nordhoff St in Chatsworth — 51,745 SF at $15 million ($290/SF). The most active price range for owner-users falls between $3M–$7M, which aligns with SBA 504 financing thresholds.
Notable recent closings:
- 21900 Marilla St — 32,789 SF at $8.5M ($259/SF) — August 2025
- 5711 Corsa Ave — 16,500 SF at $7.01M ($425/SF) — December 2025
- 20600 Plummer St — 24,000 SF at $6.5M ($271/SF) — November 2025
- 7931 Deering Ave — 22,870 SF at $6.05M ($265/SF) — February 2026
The buildings transacting are primarily 1970s-built, 15,000–25,000 SF, fully occupied at time of sale. That profile matches what owner-users are competing for.
Rent: Where We Are, Where We’re Going
Asking rents in the West SFV average $1.45/SF monthly — roughly 15% above the broader Los Angeles market average. That premium reflects the submarket’s central location and tighter functional inventory.
Rents are forecasted to remain flat through the end of 2026, then turn upward beginning in 2027, with more meaningful growth in 2028 as demand recovers and new supply remains essentially nonexistent.
For tenants: the window to negotiate favorable lease terms is now. Rate pressure won’t last.
For owners: if you’re considering a sale-leaseback or listing in 2026, the spring market is active despite softness.
The Submarkets We’re Watching Most Closely
The West SFV is not one market — it’s a collection of micro-corridors, each moving differently:
Chatsworth / Canoga Park
The highest concentration of 4 and 5-star buildings in the submarket. Rexford completed a 79,500 SF ground-up project at 19900 Plummer St in 2025. Manufacturing and owner-user driven. Strong for 10,000–30,000 SF transactions.
Reseda / Northridge Corridor
Industrial along Balboa, Deering, Corbin, and Tampa remains active for both leasing and sales. JBL’s 98,000 SF vacancy at 8500 Balboa has been available since 2024, representing opportunity for a large user or investor.
Near Van Nuys Airport
The highest concentration of existing supply in the submarket. Larger building sizes, institutional-grade product, and logistics tenants. Active but tenant-heavy market due to institutional ownership.
What This Means If You’re Buying, Selling, or Leasing in 2026
If you’re an owner-user looking to buy: This is the most favorable entry window in five years. Prices are off their peak, sellers are negotiable, and SBA 504 financing is available at competitive terms for buildings under $15M. The buildings you want — 5,000–25,000 SF, functional loading, M1/M2 zoning — are transacting at $230–$310/SF depending on condition and location.
If you own a warehouse in the West SFV: Your building has appreciated significantly from 2014 levels even with the current softness. If you’ve held for 10+ years, your equity position is strong. We’re having active conversations with sellers who want to capture gains and buyers who are ready to move. The off-market pipeline is real.
If you’re a tenant: This is a rare moment to negotiate real concessions — free rent, tenant improvement allowances, and flexible lease terms. Don’t wait for rates to recover before starting your search.
Our Team’s Activity in the West SFV
We’ve been active in Chatsworth, Canoga Park, and the West SFV throughout this cycle — representing both buyers and sellers across the 2,000–40,000 SF size range.
If you have a specific building, timeline, or question about the West San Fernando Valley industrial market, we have current, real-world data and active inventory.
Contact Art Minassian at 818-634-3722 or art@availablewarehouses.com
Contact Ron Kassan at 818-512-5001 or ron@availablewarehouses.com
Data sourced from CoStar Group, West San Fernando Valley Industrial Submarket Report, Q1 2026. Licensed to Spectrum Commercial Real Estate.